A PRIORI SCAN MINIMUM DETECTABLE CONCENTRATION CALCULATOR
STRUCTURAL SURFACES
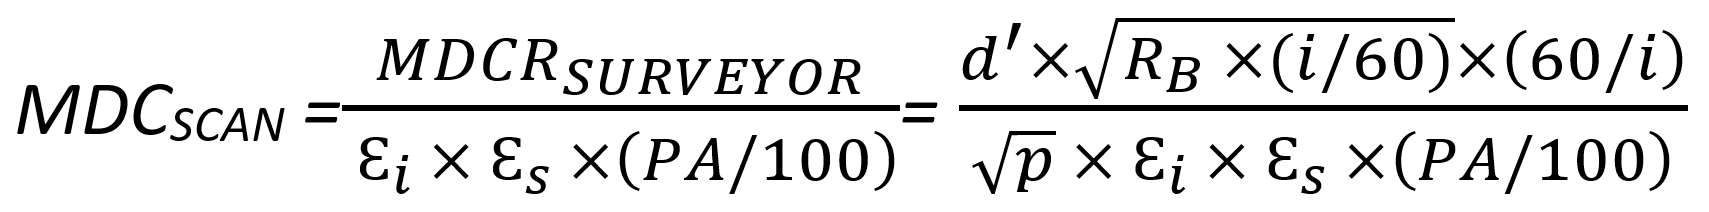
NUREG-1507 Revision 1 (2020) Minimum Detectable Concentrations with Typical Radiation Survey Instruments for Various Contaminants and Field Conditions during a Decommissioning Action presents the standard method for calculating a priori scan minimum detectable concentration (MDCSCAN) values for contaminated structural surfaces. The MDCSCAN calculation depends on many factors and input parameters (each is described below), as shown in Equation 1.
|
(Eq. 1) |
This calculator assumes contaminated surfaces are relatively clean and smooth, and otherwise free of materials such as water, dust, oil, paint, etc. that attenuate beta and alpha radiation. NUREG-1507 describes how survey planners can account for these less-than-ideal conditions, though ideal conditions are assumed here.
The calculator also assumes surveyors use standard survey methods including maintaining the detector face within a constant 1/8 to 1/4 inches (0.3 to 0.6 cm) from the surface while scanning at rate of approximately one detector face per second. Finally, it is assumed that the surveyor listens to the detector response—this method relies upon on a surveyor’s ability to hear slight increases in the response (i.e., change in the rate of the audible clicks) as the detector passes over a contaminated surface.
MDCSCAN INPUT—BETA AND ALPHA+BETA
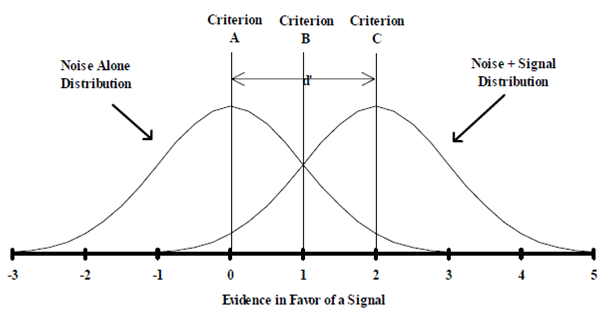
Using the provided table, enter the site-specific background count rates (RB) for the appropriate detectors and configurations—example rates are provided, though site-specific values should be used whenever possible. Also enter values for the index of sensitivity (d’) , the observation interval (i) , and the surveyor efficiency (p) . Default values are again provided, though site-specific values are preferred. These parameters are used to calculate the surveyor minimum detectable count rate (MDCRSURVEYOR) .
Two terms in Equation 1, the source efficiency (Ɛs) and the probe area (PA) , are pre-populated based on listed radionuclides and detectors combinations—no additional user input is required. Though instrument efficiency (Ɛi) values are also pre-populated, the user is expected to input values from their own calibrations or using values provide by the instrument vendor.
Finally, the user selects the relative fraction of each contaminant. This is the last input required to complete MDCSCAN calculation for beta and alpha-plus-beta detectors, but a different equation is required for alpha-only scans.
MDCSCAN INPUT—ALPHA ONLY
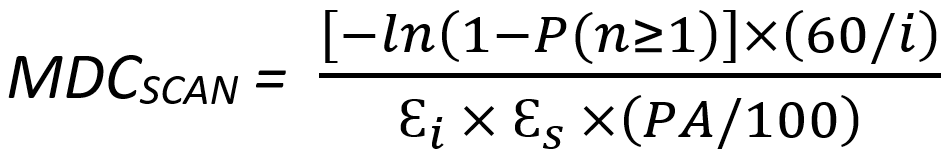
Equation 1 works when background levels are on the order of tens of counts per minute (cpm) or higher. This is the case for common beta and alpha-plus-beta detectors. For alpha-only scans, however, a different approach is required because the background response is often close to zero. That is, if the background is 1 to 3 cpm, it is assumed that the surveyor will recognize an extra count or two during a scan. The different approach for alpha-only scans is shown in Equation 2.
|
(Eq. 2) |
A new term is introduced in Equation 2: the probability of observing a single count, P(n ≥ 1) or just P , where n is the number of extra counts. The value of P is traditionally set to 0.9, presuming the surveyor will recognize n = 1 additional count 90% of the time.
MDCSTATIC INPUT
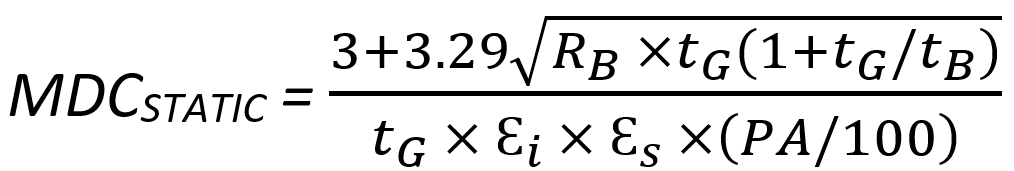
Users may also be interested in estimating the static MDC (MDCSTATIC). The MDCSTATIC is often used for testing compliance against cleanup goal or administrative threshold. That is, scanning is used to find contaminated areas while a static, or stationary, measurement is used to determine whether or not contamination levels require some action such as collecting a sample or even remediation. The MDCSTATIC equation is shown in Equation 3.
|
(Eq. 3) |
Many of the Equation 3 terms are the same as those in Equation 1, though two new terms must be introduced: the gross count time (tG) and the background count time (tB) . Most likely the gross and background count times will be identical, and the most likely count time is one minute. However, longer count times may be required when cleanup goals are relatively small and/or when contaminants are hard to detect.